Power BI Dashboard – Land Conservancy
This interactive dashboard was designed for a Michigan-based land conservancy that acquires and restores land for forest preserves using donations and grants. The dashboard provides leadership with self-service analytics, live-linked to QuickBooks and refreshed daily, enabling both high-level insights and detailed drill-downs.
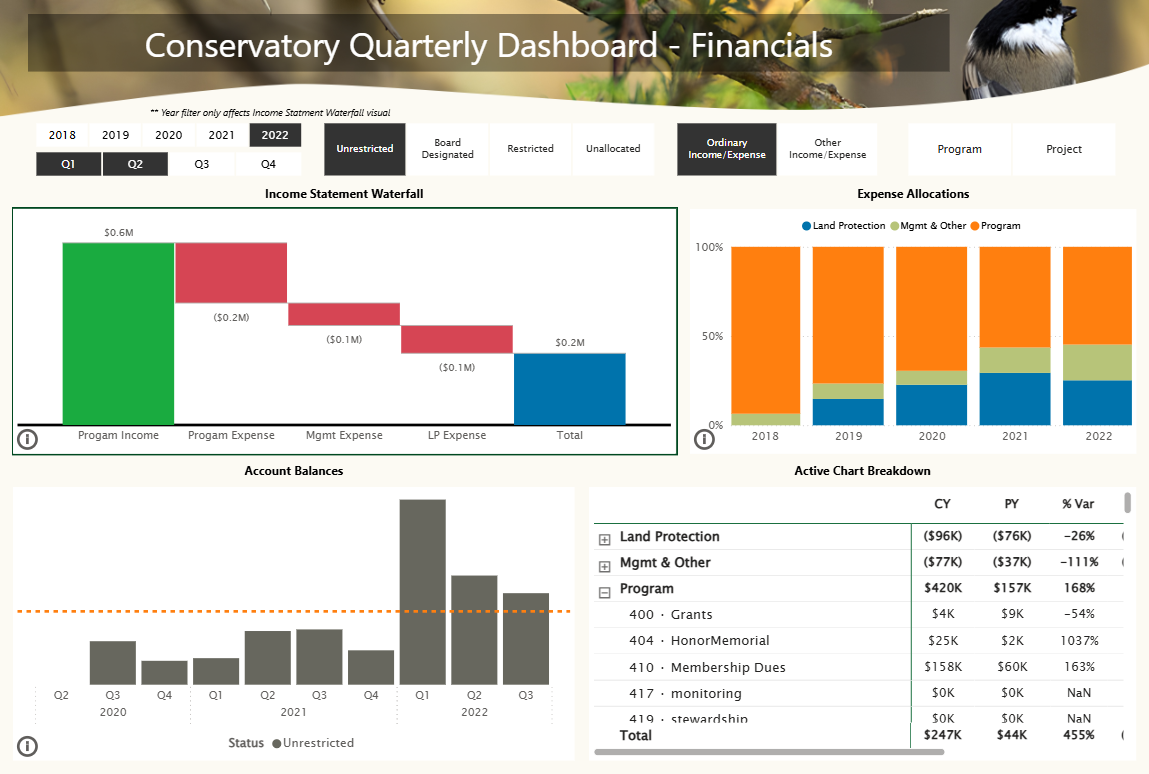
Key features include:
Income Statement Waterfall – Visualizes revenue and expenses for the selected time period. (top-left)
Expense Allocations – Breaks down annual spending by department, showing shifting priorities over time. (top-right)
Account Balances – Tracks unrestricted, restricted, and board-designated funds, segmented by how they can be spent. (bottom-left)
Drill-Down Analysis – Each chart includes an information (“i”) button that opens a supporting table, with comparisons to prior periods and the ability to drill down to the GL code level. (bottom-right)
The dashboard demonstrates strong Power BI and data modeling skills, such as:
Direct system integration with QuickBooks for automated refreshes
Slicers and filters that allow users to move from broad trends to specific transaction-level detail
Clean, intuitive visuals tailored for non-technical leadership teams
Governance-aware design that accounts for funding restrictions tied to grants and donations
This solution empowers the conservancy’s leadership to monitor cash balances, spending trends, and funding allocations in a dynamic, transparent way.
Project Three